Glossary
Automotive market research in India
Automotive market research in India covers two jobs: public and paid data on what was sold, registered and forecast, and primary research on why buyers choose as they do.

By Jitendra Kumar Nirala, Founder · Updated 24 Oct 2026
On this page
- 01Definition
- 02Which source answers which question?
- 03What does automotive market research in India cover, and which source answers which question?
- 04How many vehicles were sold in India in FY2025–26?
- 05Why do market-size figures for India's automotive market disagree?
- 06When do you need primary research on car buyers?
- 07How Qualfacto handles it
- 08Example
- 09Related terms
- 10Frequently asked
Which source answers which question in automotive market research in India?
Automotive market research in India covers two jobs: public and paid data on what was sold, registered and forecast, and primary research on why buyers choose as they do.
Key takeaways
- Automotive market research means counting the market (secondary research, which uses data that already exists) and explaining buyers (primary research, which collects new answers from people).
- For volumes, use the manufacturers' association release. For registrations, use the government dashboard. Treat paid dollar forecasts as figures to check, not facts.
- Differences in scope, unit and base year are the likely reasons for the gap in market sizes, since not every publisher states its scope.
- Move to primary research when your question starts with "why" or "what happened".
Which source answers which question?
Four publishers give four headline sizes for India's automotive market. The highest, $611 billion from Market Research Future, is about 4.5 times the lowest, $137 billion from Mordor Intelligence. They probably count different things: different units, scopes and base years.
Match your question to the right source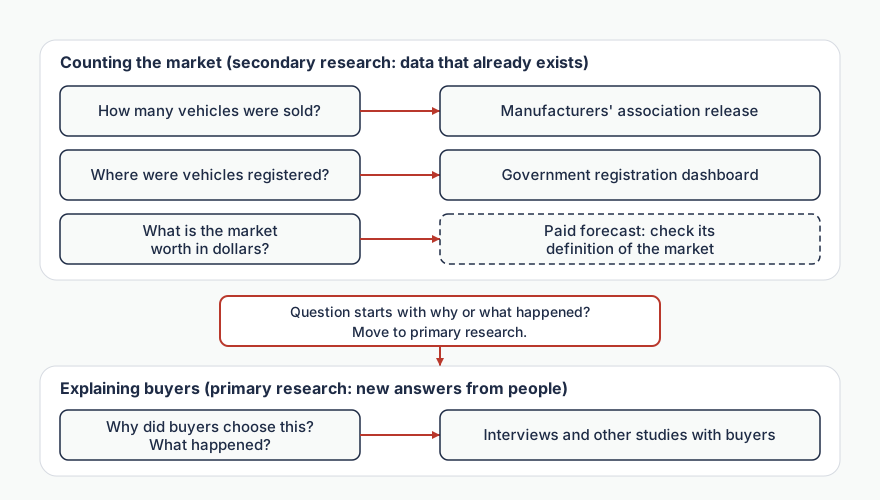
That gap decides what you should trust. A sales release tells you how many vehicles moved, but not why a buyer chose one. A registration database tells you where vehicles were registered, but not who the owner was or what they wanted. A paid forecast gives you a dollar value, but only inside its own definition of the market.
Most people who search this phrase want a number they can quote. This page shows which source to use for which question, how to check a market-size figure before you use it, and where a study with real buyers begins.
What does automotive market research in India cover, and which source answers which question?
It covers every question about vehicles, buyers and competitors, but each question has a different best source. Use the table below to match yours before you spend money.
ARAI is a Pune body whose stated work is technical: research and development, testing, certification and homologation (formal approval of a vehicle model against regulations). It is not a source of consumer research.
- Your question
- How many vehicles were sold, by segment?
- Start here
- Society of Indian Automobile Manufacturers (SIAM) FY 2025–26 release
- What it cannot tell you
- Why buyers chose them
- Your question
- How many were registered, by state, fuel or maker?
- Start here
- Vahan, the government's national vehicle registration database: public dashboard
- What it cannot tell you
- Who the owners are or what they wanted
- Your question
- Has a vehicle been tested and approved to the rules?
- Start here
- Automotive Research Association of India (ARAI)
- What it cannot tell you
- How buyers feel about it
- Your question
- What is the market worth in dollars, and what is the forecast?
- Start here
- A paid report, after the check below
- What it cannot tell you
- Anything beyond its own scope definition
- Your question
- Why do buyers choose, reject or switch? What happens in the showroom?
- Start here
- Primary qualitative research
- What it cannot tell you
- A market-wide count
How many vehicles were sold in India in FY2025–26?
India's domestic vehicle sales in the financial year April 2025 to March 2026 were about 2.83 crore units, and two-wheelers were more than three in four of them. A crore is 10 million; a lakh is 100,000.
SIAM's release of 14 April 2026 gives:
- Passenger vehicles: 46,43,439 units (+7.9%)
- Two-wheelers: 2,17,05,974 (+10.7%)
- Commercial vehicles: 10,79,871 (+12.6%)
- Three-wheelers: 8,36,231 (+12.8%)
SIAM reports record sales for every category in a financial year. The four segments add up to 2,82,65,515 units, which matches the 2.83 crore reported by the India Brand Equity Foundation (IBEF). IBEF reports two-wheelers at 76.79% of FY2025–26 units and passenger vehicles at 16.43%, which fits SIAM's segment counts.
The practical meaning: a study of "the Indian car buyer" speaks for about one vehicle in six. Say which segment you mean before you brief anyone. Sales and registrations are counted at different points, so expect SIAM and Vahan not to match exactly.
Why do market-size figures for India's automotive market disagree?
They disagree because each publisher defines the market differently: a different unit, a different scope, a different base year. Each publisher's own headline was read in October 2026.
The highest dollar figure is about 4.5 times the lowest (611.35 ÷ 137.06, calculated across base years 2024 and 2025). The growth rates range from 6.27% (Market Research Future) to 7.69% (Mordor) across these four, and Makreo gives 9.08% for FY2027 to FY2032, over different periods. Maximize states 4.56 million units but describes a market led by two-wheelers. That cannot be total domestic sales (SIAM counts about 28.3 million), so its unit definition does not match SIAM's. This is why the unit and scope checks below matter.
Before you quote any market size, run four checks. Each passes only if you can answer it from the publisher's page:
- Unit: is it dollars, rupees or vehicles? Fail if unstated.
- Scope: are two-wheelers, commercial vehicles and components in or out? Fail if you cannot list them.
- Base year and forecast period: pass only if the base year and forecast period are the same as the figure you compare it with; fail otherwise.
- Cross-check: convert the market size to units. Pass if it is within about 10% of SIAM's 2.83 crore for all vehicles, or of the matching segment; fail if it is not.
- Publisher
- Market Research Future
- Base year
- 2024
- Headline
- $611.35 billion
- What it counts
- "Automotive industry"; vehicles by type and fuel
- Publisher
- Mordor Intelligence
- Base year
- 2025
- Headline
- $137.06 billion
- What it counts
- Value of vehicles made and sold; excludes components-only revenue, aftermarket and fuels
- Publisher
- IMARC Group
- Base year
- 2025
- Headline
- $143.0 billion
- What it counts
- Vehicles by type, fuel and sales channel
- Publisher
- Maximize Market Research
- Base year
- 2025
- Headline
- 4.56 million units
- What it counts
- Units; scope unclear (page lists two-wheelers, cars and commercial vehicles)
When do you need primary research on car buyers?
You need primary research when the question is why, or what happened, because only people can answer those. A count shows a pattern; it cannot show the reason behind it.
An example: Bain & Company's Global Automotive Consumer Survey 2026, a survey of more than 12,000 car buyers across 11 markets including India, was published on 21 October 2026. As reported by The Machine Maker and Whalesbook, 82% of Indian respondents who had test-driven a battery electric vehicle would consider buying one, against 66% of those who had not. Bain does not publish the number of Indian respondents in the coverage reviewed, so treat these as indicative. That is stated willingness, not purchases. It also cannot show whether the drive changed minds or whether keener people were the ones who booked a drive. A short run of in-depth interviews with both groups would help find out. A car clinic, where consumers evaluate vehicles in a controlled setting, is one primary method for testing a design against rivals.
This is also where people confuse methods. A survey tells you how many; a qualitative study tells you how and why with smaller numbers (how to choose, and how many participants).
How Qualfacto handles it
We recruit and screen participants in India for paid qualitative studies, and Automotive & Mobility is one of our study categories. A study starts with your brief: objective, method, audience, geography, sample and timeline (a one-page brief template helps).
We can field in-depth interviews (30 to 120 minutes), focus groups (1 to 3 hours), diary studies, ethnography, in-home use tests and usability tests. For shop-alongs we recruit, screen and coordinate the shoppers. We recruit by city and by household and demographic profile, check participant identity before invitation, and run sessions in languages other than English. What you receive (recordings, transcripts, data exports or a report) is agreed before fieldwork starts.
We price each project individually and offer a free pilot. Email your brief to support@qualfacto.io, or message us on WhatsApp for a quick first discussion (Monday to Friday, 10:00 to 18:00 Indian Standard Time (IST); we aim to reply within one business day). For recruitment basics, read how to recruit participants for a study in India.
Example
A report that gives India's automotive market as 4.56 million units can be tested with check 4. Set against SIAM's roughly 28.3 million vehicles for FY2025–26, 4.56 million is only about 16% of the total, far outside the 10% tolerance, so the figure fails the cross-check and should not be quoted as total domestic sales.
Frequently asked
Sources
- 1.SIAM, FY 2025–26 industry performance release, 14 April 2026
- 2.IBEF, Indian automobile industry, September 2026
- 3.Vahan public dashboard, Parivahan
- 4.Bain & Company, Global Auto Consumer Survey, 21 October 2026
- 5.The Machine Maker, Bain survey report
- 6.Whalesbook, Bain survey report
- 7.Market Research Future, India automotive industry
- 8.Mordor Intelligence, India automobile market
- 9.IMARC Group, India automobile market
- 10.Maximize Market Research, India automotive market
- 11.Makreo, India automotive market
Questions about automotive market research?
Email your brief to support@qualfacto.io or message us on WhatsApp for a quick first discussion.