Brand Perception Research: How Many People You Need in India
Brand perception research needs 700 to 1,100 survey respondents per round to detect a 5-point awareness change from a 10% to 20% start, plus about 10 interviews per group.

By Jitendra Kumar Nirala, Founder · Updated 5 Nov 2026

Key takeaways
- Use a survey to count awareness and interviews to explain it. If a survey of 300 people reads 10% awareness, true awareness could be anywhere from 7.1% to 13.9%.
- To see a 5-point move in awareness between two survey rounds, you need about 700 to 1,100 respondents per round from a 10% to 20% start, about 430 from 5% and about 1,400 from 30%. Below that, treat the survey as a snapshot and put the budget into interviews.
- Plan about 10 interviews for each group you want to compare, and recruit 20% more than you need to allow for no-shows. Four groups come to 40 interviews, so recruit 48.
- Ask people about the last time they bought, not what they think of brands in general. What people say and what they do often differ.
In this article
- 1What is brand perception research, and what should it tell a small brand?
- 2How many survey respondents does brand perception research need?
- 3When should you use a survey, interviews, or both?
- 4How many brand perception interviews do you need, and with whom?
- 5What should a brand perception interview guide ask?
- 6How do we recruit and run brand perception interviews at Qualfacto?
- 7Frequently asked questions
A survey of 300 people cannot tell you whether awareness moved from 10% to 15%, and it never tells you why.
A survey gives you a count. An interview gives you the words people use, the rival they compare you with and the moment they stopped buying. A team deciding on a tagline, a price position or a pack redesign needs both, in the right proportion.
This page works out how many survey respondents are enough, how many interviews to run and with whom, and what a moderator should ask. Every figure we calculated shows its working.
It is written for brand, insights and marketing teams, agencies and founders in India who have to commission or run the study.
What is brand perception research, and what should it tell a small brand?
Brand perception research finds out what people believe your brand is, as opposed to what you intend it to be. It answers two different questions: how many people hold a belief, which needs a survey, and why they hold it, which needs interviews.
Awareness is the first count. Unaided awareness means people name your brand when you only mention the category. Aided awareness means they say they know it once you show the name. Perception goes further: the words people attach to you, who they think you are for, how they rate you against the nearest rival, and what makes them hesitate.
How many survey respondents does brand perception research need?
You need about 700 to 1,100 respondents per round to see a 5-point move when awareness starts at 10% to 20%; the figure is about 430 from a 5% start and about 1,400 from 30%. With a few hundred, a single reading is a wide range, not a number.
This is our own calculation. It uses the 95% Wilson confidence interval, which is the range that would contain the true share in 95 of 100 repeat surveys. For a share p among n people, with z = 1.96:
(p + z²/2n ± z·√(p(1−p)/n + z²/4n²)) / (1 + z²/n)
Here z = 1.96 is the value for 95% confidence, p is the share written as a decimal (0.10 for 10%), and n is the number of respondents.

| Respondents | Survey reads 5% | Survey reads 10% | Survey reads 30% |
|---|---|---|---|
| 100 | 2.2% to 11.2% | 5.5% to 17.4% | 21.9% to 39.6% |
| 300 | 3.1% to 8.1% | 7.1% to 13.9% | 25.1% to 35.4% |
| 1,000 | 3.8% to 6.5% | 8.3% to 12.0% | 27.2% to 32.9% |
Splitting a sample makes this worse. A 1,000-person survey cut into four cities leaves about 250 per city. At 10% awareness, each city's reading carries a margin of about ±3.7 points (1.96 × √(0.10 × 0.90 / 250)).
To compare two separate survey rounds, we used the standard sample size for two proportions at 95% confidence and 80% power, where power is the chance of spotting a real change:
n per round = (1.96·√(2p̄(1−p̄)) + 0.8416·√(p₁(1−p₁) + p₂(1−p₂)))² / (p₂ − p₁)²
Here p₁ and p₂ are awareness in the first and second rounds, and p̄ is their average.
| Awareness moves from | to | Respondents per round |
|---|---|---|
| 5% | 10% | 435 |
| 10% | 15% | 686 |
| 20% | 25% | 1,094 |
| 30% | 35% | 1,377 |
| 5% | 8% | 1,059 |
| 10% | 13% | 1,774 |
Halving the change you want to detect roughly quadruples the sample. These figures assume a simple random sample, where everyone in the target group has an equal chance of being picked. A quota sample, which fills set numbers by city, age and so on, is usually less precise, so in our judgement you should treat these as the best case and plan for more.
When should you use a survey, interviews, or both?
Use a survey when you can field enough people to read a trend, use interviews whenever you must decide what to change, and use both when the budget allows. The deciding factor is whether your sample can detect the change you care about.
| Your situation | What we would do |
|---|---|
| You can field enough for your starting point (about 430 from 5% awareness, 700 to 1,100 from 10% to 20%, about 1,400 from 30%) and care about a 5-point move | Repeat the survey each round and run interviews in the first round. Re-interview when the numbers move unexpectedly. |
| You can field about 300 | Run one survey as a snapshot, not a trend line. Spend the rest of the budget on interviews. |
| Awareness is under 10% | Do not make aided awareness the headline number. Interview your few buyers, your rival's buyers and category buyers who have not heard of you. |
| You are choosing a tagline, a price position, a pack or a name | Interview first. A survey can then test the two or three options interviews leave standing. |
Surveys also have a built-in weakness. Nielsen Norman Group, a research and consulting firm, notes that what people say and what they do are often quite different, partly because of imperfect memory and social desirability bias, the wish to give the answer that looks good. An interview lets a moderator go back to a real purchase and ask what happened, which a tick-box cannot do.
How many brand perception interviews do you need, and with whom?
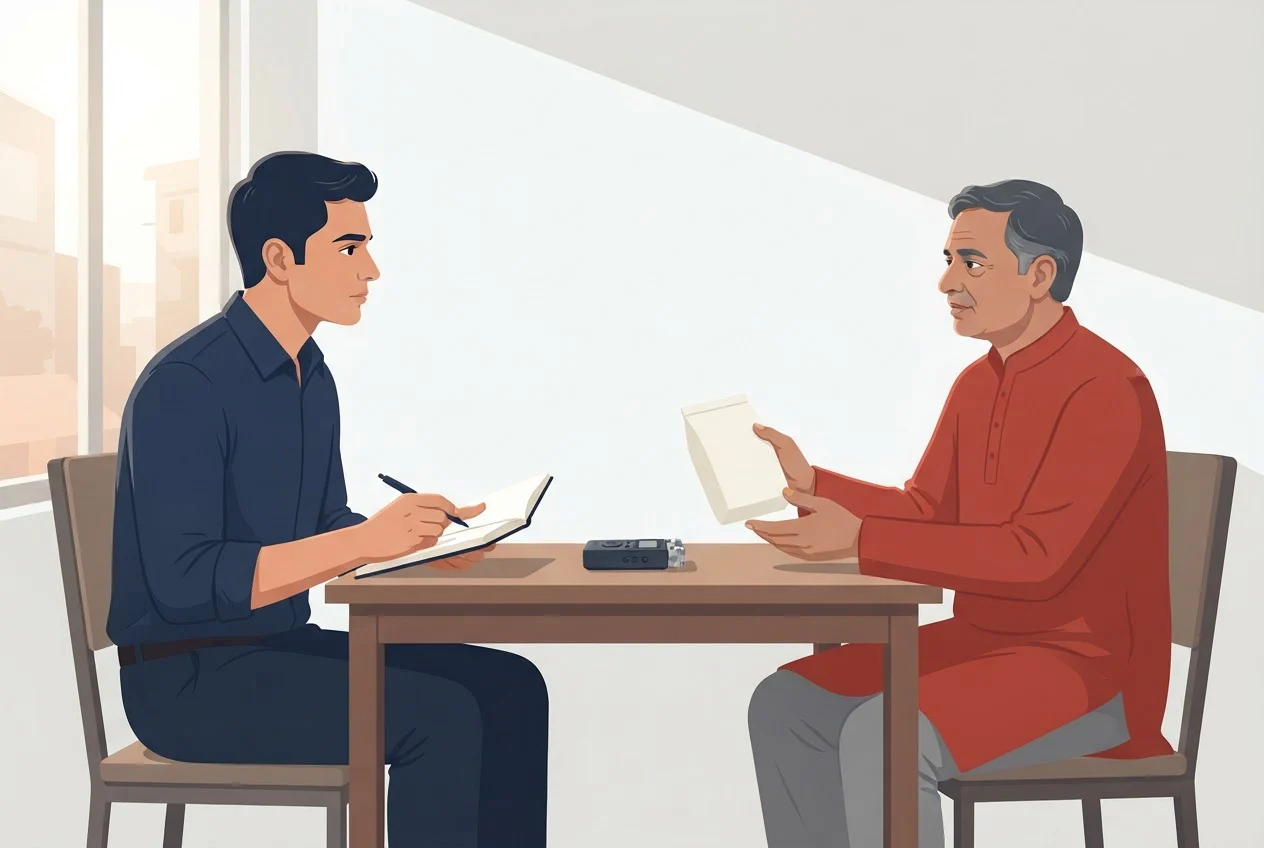
Plan about 10 in-depth interviews (IDIs, one-to-one conversations of 35 to 55 minutes) for each group you want to compare, and recruit 20% more to cover no-shows. For brand perception, four groups is a sensible starting set.
In a study of 60 interviews in two West African countries, Guest, Bunce and Johnson (2006) found that saturation, the point where new interviews stop producing new themes, came within the first twelve interviews, with the main themes visible by six. Hennink and Kaiser (2022), a systematic review of empirical saturation studies, gives a range of 9 to 17 interviews. Ten per group is our recommendation within that range. Our sample size in qualitative research page covers how to size each group.
| Group | Who to recruit | What you learn | Interviews | Recruit (+20%) |
|---|---|---|---|---|
| Current buyers | Bought your brand recently | Why they choose you, in their words | 10 | 12 |
| Lapsed buyers | Bought before, not recently | The moment and reason they left | 10 | 12 |
| Rival's buyers | Regular buyers of your nearest competitor, never yours | What your brand looks like from outside | 10 | 12 |
| Unaware category buyers | Buy the category, have not heard of you | First impressions when shown the brand | 10 | 12 |
| Total | 40 | 48 |
The working: 4 groups × 10 interviews = 40; 10 × 1.2 = 12 per group; 4 × 12 = 48. At 35 to 55 minutes each, 40 interviews mean about 23 to 37 hours of conversation (40 × 35/60 and 40 × 55/60 hours).
Two cautions:
- Every city or language you compare multiplies the groups. Two cities across four groups is eight groups and 80 interviews. Choose your groups first and your cities second.
- Screen out friends, colleagues, and anyone who works in marketing, research or for a rival. They tell you what is polite, or what they already know. Our research screener template covers the screening questions.
What should a brand perception interview guide ask?
A good guide moves from a real past purchase, to unprompted associations, to the brand shown, to a rival, to doubts. It asks about unprompted brands before showing yours, because once people have seen your name they cannot un-see it.
| Block | Minutes | Ask | Listen for |
|---|---|---|---|
| Opening and consent | 5 | Purpose, recording permission, "there are no right answers" | Comfort, any objection to recording |
| Last purchase | 5 | "Walk me through the last time you bought [category]." | Trigger, place, who influenced the choice |
| Unprompted associations | 5 to 10 | "Which brands come to mind for [category]? Why?" Then show your brand: "What are the first words that come to mind?" | Whether you appear unprompted, and the words used |
| Brand as a person | 5 to 10 | "If this brand were a person at a family wedding, who would they be, and who would they talk to?" | Personality words, the kind of person they imagine |
| Rival side by side | 5 to 10 | "Put [your brand] and [rival] side by side. What makes you pick each?" | The trade-off, in their own language |
| Doubts | 5 to 10 | "What would make you hesitate to buy this?" | Trust gaps, price worries, old experiences |
| Close | 5 | "Is there anything I should have asked?" | Topics you missed |
"Brand as a person" is a projective technique: asking people to describe the brand as a person, so they say what they would otherwise not put into words. To go deeper on any answer, such as why a word like "reliable" matters to them, use the laddering technique. For the full interview plan, see our in-depth interview method guide.
Run the interviews in the language people think in. For India, decide city, language and socio-economic class before you recruit, because each one you compare adds a full set of groups, as the two-city example above shows. Recruiting by class is covered in NCCS classification, and fieldwork in more than one language in multilingual research. Ask the same questions in every group so you can compare, and probe each answer with why and when.
How do we recruit and run brand perception interviews at Qualfacto?
We recruit the participants for each group, check their identity before inviting them, and fill the sessions across Indian cities and languages. Sessions run online or in person, and we agree what you receive before the study starts.
In practice:
- Recruitment. We recruit by city and by household and demographic profile, using a screener built from your groups. People join our panel free of charge and are invited only when their profile fits a study. Registration does not guarantee an invitation.
- Sessions. We run IDIs of 30 to 120 minutes and focus groups of 1 to 3 hours, in English or other languages. We can supply the moderator and handle fieldwork; who moderates is agreed in the scope before the study begins.
- What you get. Depending on scope: recruitment, fieldwork materials, recordings, transcripts, structured data exports and a research report. These are agreed before the study begins.
- Price. We have no fixed rate card. We price each project from your brief, based on method, audience, sample, geography and how hard the participants are to recruit.
- A free pilot. We offer a free pilot before you commit to a full project. We review your brief for feasibility, then send a tailored proposal and quote.
To start, email your brief to support@qualfacto.io: the groups you want to hear from, their cities and languages, the sample size and the timeline. We aim to reply within one business day, Monday to Friday, 10:00 to 18:00 Indian Standard Time (IST). For quick queries you can also use WhatsApp.
Get your brand perception study scoped in India
Email your brief to support@qualfacto.io and we will review it for feasibility, then send a tailored proposal and quote.
Frequently asked questions
Sources
- 1.How Many Interviews Are Enough? An Experiment with Data Saturation and Variability, Field Methods 18(1), SAGE, 2006
- 2.Sample sizes for saturation in qualitative research: a systematic review of empirical tests, Social Science & Medicine 292, 2022
- 3.Attitudinal vs. Behavioral Research, Nielsen Norman Group, 2024
- 4.Confidence intervals, detectable-change sample sizes and the interview-group plan on this page are our own calculations from the formulas shown, using 95% confidence, 80% power and a simple random sample.