FMCG Market Research in India: Pick the Method by Decision
FMCG market research in India starts with the decision: shop-alongs for shelf problems, home use tests for repeat use, interviews for switching. Recruit by channel and spend band, not rural or urban.

By Jitendra Kumar Nirala, Founder · Updated 9 Nov 2026
Key takeaways
- Choose the method from the decision, not the category: shop-along for shelf problems, in-home use test for repeat use, interviews and groups for switching and price, diary study for routine.
- Define each group of participants (a "cell") by the channel where they buy, their household spend band and their city. "Rural" and "tier-2" hide too much difference.
- The national FMCG picture changed sign in two quarters, so date-stamp every brief and recheck its assumptions each quarter.
- Start with about 12 people per cell for interviews and groups (8 to 10 per segment for shop-alongs), cap the number of cells, and use a survey, not interviews, when you need percentages.
In this article
- 1Which method fits which FMCG market research decision?
- 2Why should an FMCG market research brief be rechecked every quarter?
- 3Why is "rural versus urban" a poor way to recruit for FMCG research?
- 4How many people does an FMCG qualitative study need?
- 5What should an FMCG research brief contain, and how do you check it?
- 6How do we run FMCG qualitative research at Qualfacto?
- 7Frequently asked questions
In April to June 2026, rural volumes of fast-moving consumer goods (FMCG) in India fell 5% while urban volumes stayed flat, as Outlook Business reported on 29 September 2026. Two quarters earlier, in October to December 2025, rural volumes had grown faster than urban (NIQ, 13 March 2026). A brief written on the older picture would be out of date before fieldwork starts.
FMCG covers packaged food, drinks, personal care and home care. This page is for brand, insights and D2C (direct-to-consumer) teams, and for agencies, who are commissioning consumer research in India. For market size, see the quarterly India FMCG releases from NielsenIQ (NIQ).
The harder choice is who to recruit. Briefs often say rural or urban and lean on last year's trend. Both habits fail, and national spending data shows why. Below you get a decision table, a cell planner and a quarterly check to paste into a brief, whichever fieldwork partner you use.
Which method fits which FMCG market research decision?
Match the method to the decision. Use a shop-along when the problem is at the shelf, an in-home use test when it is repeat use at home, an in-depth interview (IDI) or focus group discussion (FGD) when it is why people switch or react to price, and a diary study when it is routine across days.
| Decision | Method | Who to recruit | What you see |
|---|---|---|---|
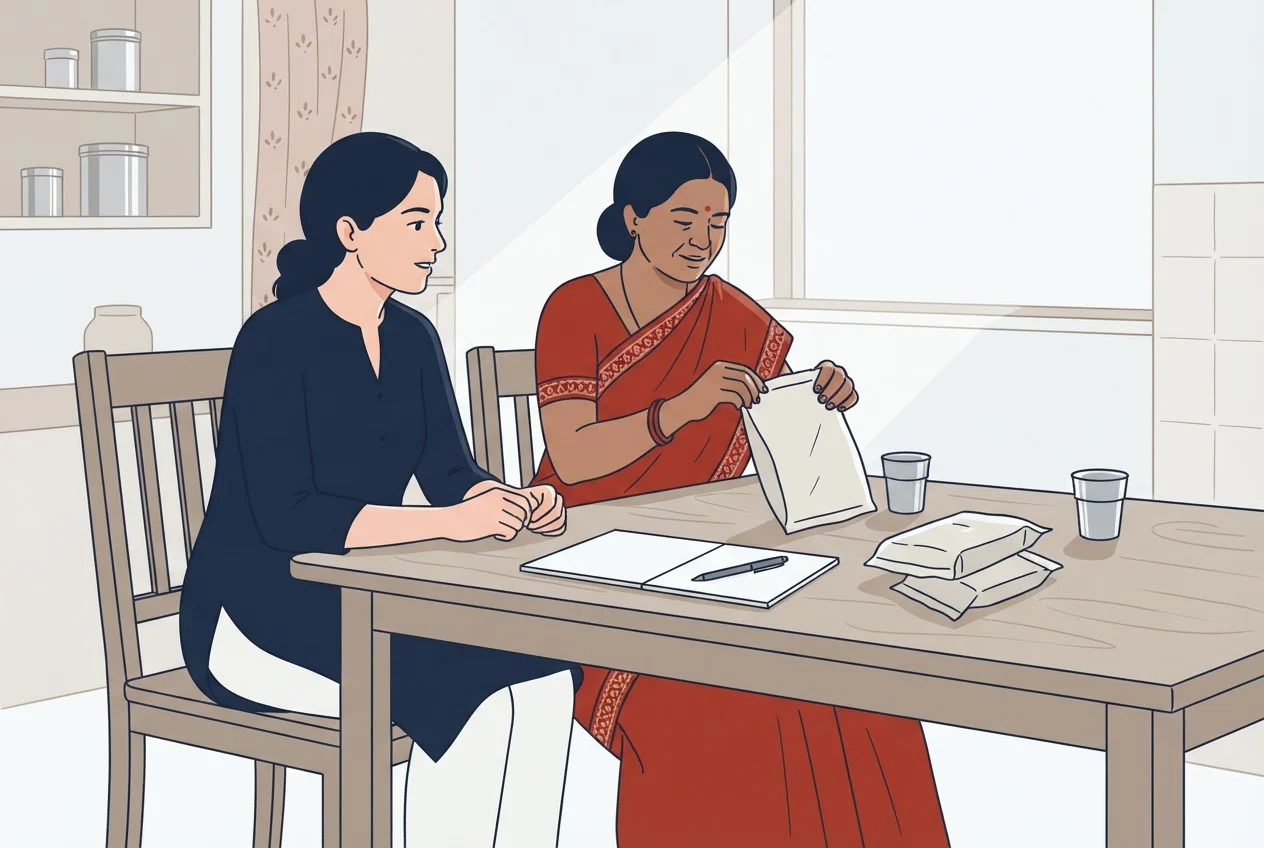
| Shoppers walk past the pack | Shop-along: we accompany or screen-share a purchase, in store or online | Buyers of the category in the one channel under test | What is noticed, read and picked instead |
| Tried once, not bought again | In-home use test (IHUT): product used at home over several days | Households that match the target user, by spend band | Use, storage and repeat intent in a real home |
| Why people switch brand or balk at a price | IDI: one-to-one conversation of 30 to 120 minutes | Current buyers and recent switchers, one cell at a time | Reasons in the buyer's own words |
| Reaction to a claim, name or advertisement | FGD: moderated group of 1 to 3 hours | One cell, one language per group | The words people use and where they disagree |
| How the category fits a week | Digital diary study: multi-day photo and video tasks on a phone | Households grouped by routine | Occasions and moments you would not think to ask about |
Two more formats suit particular questions. Ethnography (home visits or virtual sessions) fits questions about kitchens, bathrooms and storage. An online bulletin board (people answering over several days) fits questions that need thought rather than speed.
For pack tests specifically, our packaging research guide covers what to test and how many people. For household counts in home tests, see our in-home use test guide.
All of these are qualitative: they explain why, among a small number of people. They cannot tell you what share of India does something.
Why should an FMCG market research brief be rechecked every quarter?
Our recommendation: recheck the market assumptions behind a brief each quarter, because national rural and urban FMCG volume growth reversed between October to December 2025 and April to June 2026. NIQ tracks FMCG sales every quarter, so the latest release is the quickest check.
| India FMCG volume growth | October to December 2025 | April to June 2026 |
|---|---|---|
| Rural | +2.9% | −5% |
| Urban | +2.3% | +0.1% |
| Rural minus urban (percentage points) | +0.6 | −5.1 |
The October to December 2025 figures are from NIQ's release of 13 March 2026. The April to June 2026 figures are as reported by Outlook Business on 29 September 2026; Daily Pioneer reported the same headline volumes on 28 September 2026. The last row is our subtraction: rural minus urban, so the gap moved from +0.6 to −5.1, a swing of 5.7 percentage points. As of 9 November 2026, the latest quarter used here is April to June 2026; January to March 2026 is not shown.
Channels moved even further apart. In April to June 2026, Outlook Business reported traditional trade (neighbourhood shops, known as kiranas) down 6% in volume, modern trade (supermarket chains) up 17.5% and e-commerce up 34.8%, with e-commerce at 7% of national FMCG sales. In October to December 2025, quick commerce (groceries delivered in minutes through an app) made up over three-quarters of e-commerce FMCG sales, according to NIQ.
These are all-FMCG averages, so your category can behave differently. Our recommendation: name the channel in every cell, and state in the brief which quarter's data your assumptions come from.
Why is "rural versus urban" a poor way to recruit for FMCG research?
Rural India holds households with very different budgets, so the rural label puts them in one group. The gap between the poorest and richest 5% of rural people is 6.0 times, while the gap between average rural and average urban spend is 1.7 times.
India's Ministry of Statistics and Programme Implementation (MoSPI) measures this with monthly per-capita consumption expenditure (MPCE), the spend per person per month. As MoSPI defines it, MPCE here excludes the value of items received free through welfare programmes. Its Household Consumption Expenditure Survey 2023-24, with fieldwork from August 2023 to July 2024, gives these figures:
- Average MPCE was ₹4,122 in rural India and ₹6,996 in urban India, a ratio of 1.7 (our division: 6,996 ÷ 4,122).
- The bottom 5% of rural people averaged ₹1,677 and the top 5% averaged ₹10,137, about 6.0 times as much (our division: 10,137 ÷ 1,677).
- Like for like, the rural 80 to 90% band averaged ₹5,763, close to the urban 40 to 50% band at ₹5,622.
- The top 5% of rural people (₹10,137) spent about the same as the urban 80 to 90% band (₹10,139), and about 4.3 times the urban bottom 5% (₹2,376; our division: 10,137 ÷ 2,376).
- Among States, rural MPCE ran from ₹2,739 in Chhattisgarh to ₹9,377 in Sikkim, about 3.4 times (our division: 9,377 ÷ 2,739).
A "rural" cell can therefore hold a household that buys the smallest pack and one that buys the premium variant. Ask for a spend band in the screener instead, or use a socio-economic grade. Our guide to NCCS classification explains how to recruit by socio-economic class in India.
How many people does an FMCG qualitative study need?
Our recommendation: plan about 12 people per cell for interviews and groups, usually 8 to 10 per shopper segment for shop-alongs, and keep the number of cells small. The cells, not the interviews, are what make a study expensive. End a cell's fieldwork when three sessions in a row add no new reasons for choice.
A study of 60 in-depth interviews with women in two West African countries found that themes were largely established within the first 12 interviews, with the basic elements present by 6 (Guest, Bunce and Johnson, Field Methods, 2006). It is one study of a fairly similar group, so treat 12 as a starting point for interviews in one tightly defined cell, not a universal rule.
Our planner, a model rather than an official figure:
- Interviews = channels × spend bands × cities × 12.
- Example: 3 channels (kirana, modern trade, quick commerce) × 3 spend bands × 2 cities = 18 cells × 12 = 216 interviews.
- Cut to the cells where the decision could differ. If a pack problem exists only in kiranas, 1 channel × 3 spend bands × 2 cities = 6 cells × 12 = 72 interviews. A first pilot at 6 per cell is 6 × 6 = 36.
Plan extra recruits for no-shows. If you need percentages, such as the share of buyers who prefer design A, run a survey; our quota sampling calculator shows cell sizes for that.
What should an FMCG research brief contain, and how do you check it?
A good brief names the decision, the quarter of data behind it, and every cell. Paste this block into your own brief:
Decision this study informs:
Market assumptions and their date (for example, NIQ snapshot, April to June 2026):
Method (shop-along, IHUT, IDI, FGD, diary):
Cells (channel / spend band / city):
People per cell (12 for interviews and groups, 8 to 10 for shop-alongs; 6 for a pilot):
Screener must-haves (bought the category in the stated window, in the named channel):
Languages:
Deliverables (recordings, transcripts, data export, report):
Timeline:
Run these five checks before you send it:
- Date.Pass: the brief names the quarter of its market data and it is the latest published. Fail: no date, or an older quarter.
- Channel.Pass: each cell names one channel and the screener asks where the category was bought last. Fail: "buys FMCG".
- Spend.Pass: each cell has a spend band or socio-economic grade. Fail: only "rural", "urban" or "tier".
- Decision link.Pass: each cell maps to a decision the brief names. Fail: any cell no decision depends on.
- Purchase window.Pass: the screener states how recently the person bought the category. Fail: it asks only whether they ever have.
How do we run FMCG qualitative research at Qualfacto?
We take your brief and run the recruitment and fieldwork. Our formats include IDIs, FGDs, shop-alongs (in store or online), in-home use tests, diary studies, ethnography and online bulletin boards. Food and beverage, beauty and FMCG are among the study categories we work in.
You send the objective, method, target audience, participant profile, geography, sample size, timeline and recruitment criteria. We check feasibility and send a tailored proposal and quote. There is no fixed rate card; we price each project from its method, audience, geography, sample and how hard the profile is to recruit.
We recruit by city and by household and demographic profile, check participant identity before invitation, run sessions in languages other than English, and can supply moderators. Deliverables such as recordings, transcripts, data exports and reports depend on the scope and are agreed before the study begins. Our shop-along research page describes that format in detail. We offer a free pilot.
To start, email your brief to support@qualfacto.io. We aim to reply within one business day, Monday to Friday, 10:00 to 18:00 IST (Indian Standard Time).
If you would rather take part in studies like these, see how to join and get invited. Registration is an expression of interest only. Invitations depend on each study's requirements and your profile, and rewards depend on the study's terms.
Send us your FMCG research brief
Email your brief to support@qualfacto.io and we will check feasibility and send a tailored proposal and quote.
Frequently asked questions
Start with NIQ's news center for India FMCG quarterly releases and MoSPI's Household Consumption Expenditure Survey 2023-24 press note for household spending. They give quarterly sales growth and spend, but not category-level detail for your product.
Cost depends on the method, the number of cells, the geography and how hard the profile is to recruit. Cost follows the number of cells and people, so a 36-interview pilot is a smaller commitment than a 216-interview study. See our focus group cost guide and user research recruitment cost guide. We have no fixed rate card: email support@qualfacto.io with a brief for a quote.
Sources
- 1.NIQ: GST 2.0 Transition Reshapes India's FMCG Growth Landscape, NielsenIQ, 13 March 2026
- 2.News center (India FMCG quarterly releases), NielsenIQ
- 3.FMCG Slowdown Is Splitting India's Consumer Basket, Outlook Business, 29 September 2026
- 4.FMCG growth moderates in June quarter: NielsenIQ, Daily Pioneer, 28 September 2026
- 5.Household Consumption Expenditure Survey: 2023-24, press note, Ministry of Statistics and Programme Implementation, 27 December 2024
- 6.How Many Interviews Are Enough?, Guest, Bunce and Johnson, Field Methods, 2006